Analytics for promoters: Control revenue and performance across all your events

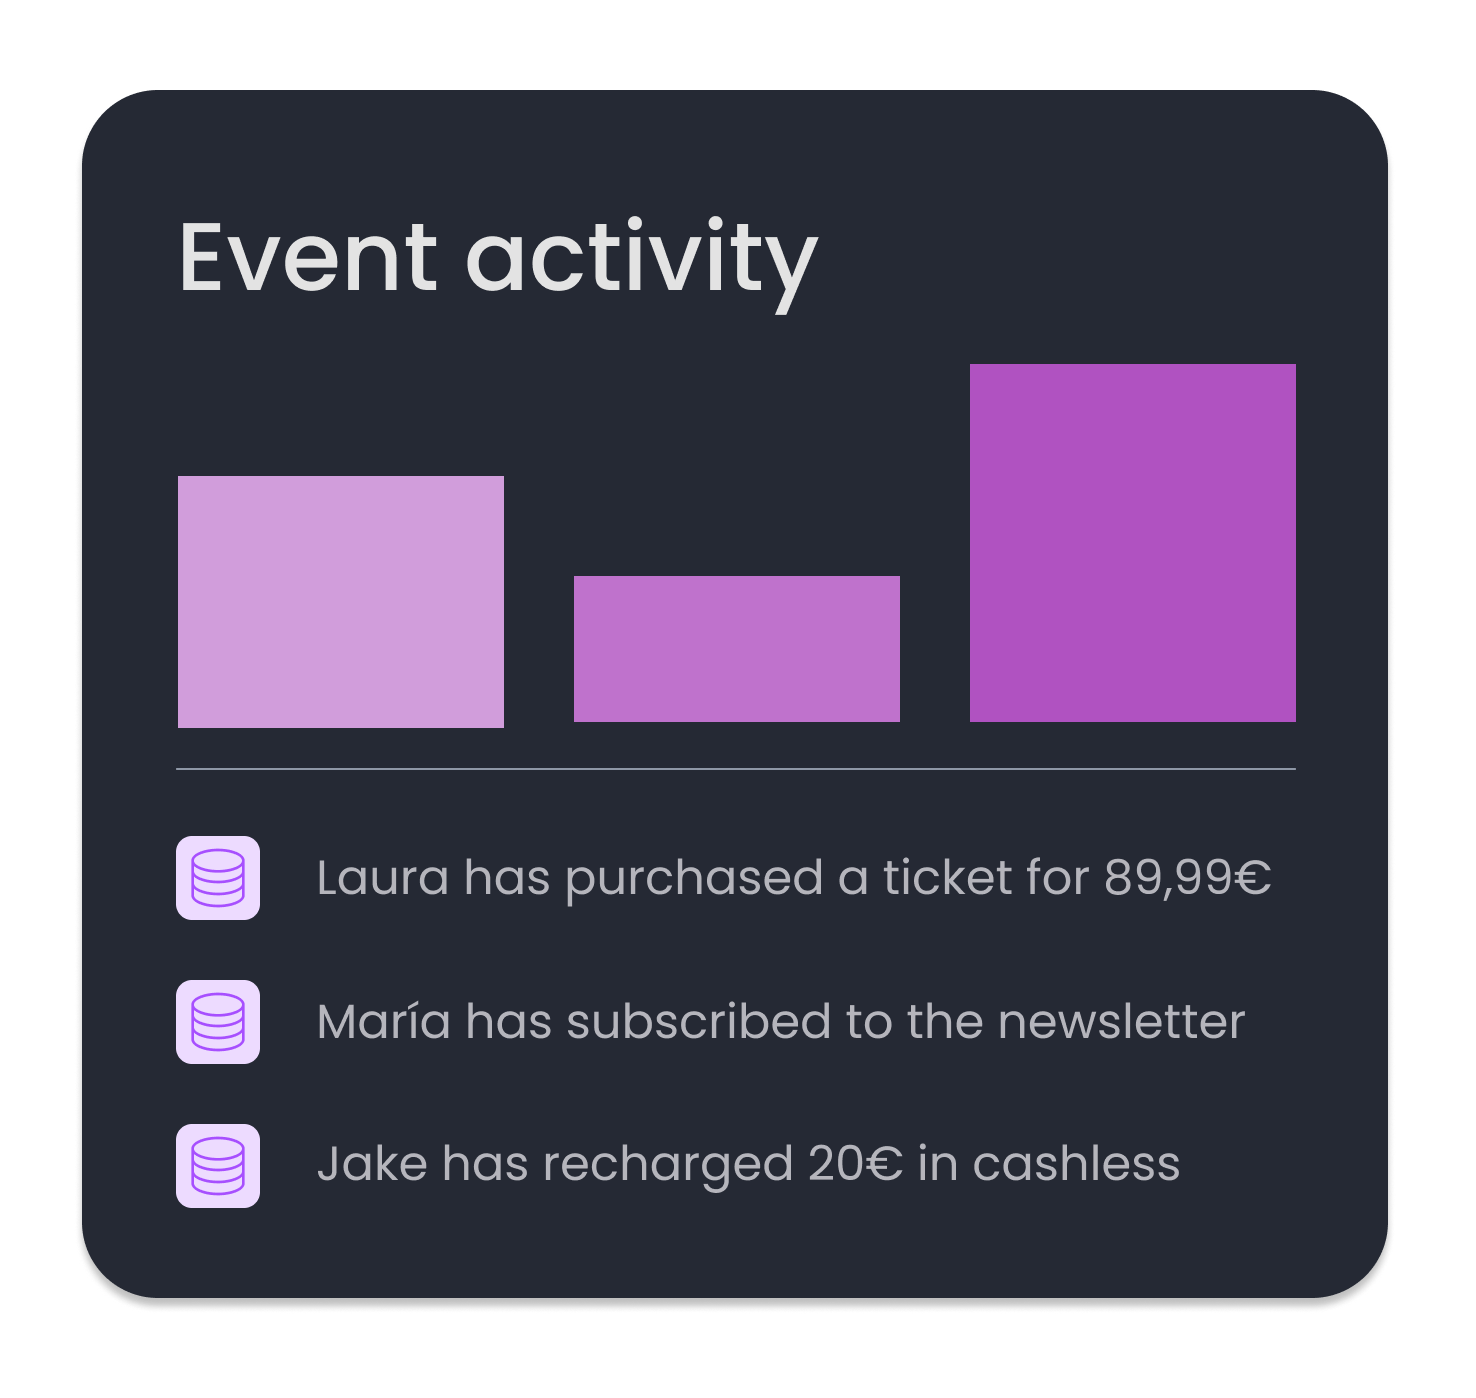
Real-Time Revenue Dashboard
Control revenue from all your events in one place. Visualize real-time billing for each event: total revenue, tickets sold, average price, revenue by sales channel. Compare economic performance between your summer festival (€450K billed), your 12 monthly concerts (€85K) and corporate events (€120K). Identify which events generate more margin and where you're losing money.

Where Your Revenue Comes From
Attribution analysis revealing the real source of your sales: How many tickets did your email campaign sell vs. your Instagram stories? What percentage of billing comes from your own database vs. paid advertising? Identify the real ROI of each channel: you invest €2K in Meta Ads and generate €8K in tickets, but your zero-cost email marketing bills €15K.

Compare Performance Between Events and Editions
Economic comparison between all your events: revenue per attendee, customer acquisition cost (CAC), net margin, sell-through rate. Compare previous editions: Did your 2025 festival sell faster than 2024? Did average ticket increase? Did marketing cost per ticket sold decrease? Make data-driven decisions: repeat winning format, cancel unprofitable events.

Sales Projection and Performance Alerts
Real-time projection of final sales based on current pace: "At this rate you'll sell 2,400 tickets out of 3,000 capacity". Automatic alerts when an event is slow: "Saturday concert has 30% fewer sales vs. same point last week". Compare sales velocity between similar events and adjust strategy before it's too late.
Why promoters love CRM for events
Stop guessing, start knowing what works
Frequently asked questions
Can I see in real-time how much I'm billing with each event?
Yes. Real-time dashboard showing accumulated revenue, tickets sold, average price and final sales projection. Updated every time a ticket is sold thanks to direct integration with your ticketing system (Dice, Fever, Xceed, Enterticket, Onebox, Casfid, Fourvenues). You can filter by event, date, ticket type or sales channel.
How do I know where my ticket sales really come from?
Multi-touch attribution system that tracks the complete customer journey: email → click → SMS → purchase. Each sale is assigned to the channel that originated it. You see exactly: Email = 450 tickets sold (€13.5K), Instagram Stories = 120 tickets (€3.6K), Meta Ads = 80 tickets (€2.4K), etc. You can also see the combination of channels that generated each sale (first-touch, last-touch, multi-touch attribution).
Can I compare billing between different events?
Yes. Comparative dashboard showing revenue, tickets sold, average price, CAC (Customer Acquisition Cost) and margin of all your events side by side. You can filter by event type (festival, concert, corporate), date, music genre, capacity, etc. Identify which are most profitable and replicate the winning strategy in other events.
How do I compare my 2025 festival vs 2024 to know if it grew?
Automatic year-over-year analysis with key metrics: % growth in revenue, sales velocity (days to sell-out), average ticket, marketing cost per ticket sold, audience retention between editions (% of 2024 attendees who bought for 2025), and billing comparison by phase (early bird, on sale, last minute). Visualize long-term trends with historical charts.
What is CAC (Customer Acquisition Cost) and how do I calculate it?
CAC = Total marketing cost / Number of tickets sold. Example: You spend €5K on marketing (email, ads, influencers, content) and sell 1,000 tickets = CAC of €5 per ticket. Nevent calculates this automatically per event and channel, showing where you acquire customers cheaper. We also compare your CAC vs. customer lifetime value (LTV) to see if your acquisition is profitable long-term.
Can I see which type of audience generates more revenue for me?
Yes. Segment analysis showing revenue by group: VIP vs. General Admission, early birds vs. last minute, returning vs. new, by age range (18-25, 26-35, 36-45, 46+), geographic location, favorite music genre, etc. Identify your most profitable audience and focus your marketing on that segment. For example: "VIP generate 35% of revenue with only 12% of tickets sold" or "Returning attendees have 60% lower CAC than new ones".
Do metrics integrate with my current ticketing system?
Yes. Native integration with Dice, Fever, Xceed, Enterticket, Onebox, Casfid and Fourvenues. We also integrate with e-commerce platforms like Shopify and WooCommerce, and with Meta (Facebook/Instagram Ads). Sales data syncs automatically in real-time. We also offer open API for any custom system. The support team helps with integration setup.
Thousands of promoters trust Nevent